I’m sure you’ve seen a lot written about both the US forced labour law and the upcoming EU Forced Labour Regulation. Clearly, there are new and heightened risks for companies — but what do these risks actually mean? How will, could (or actually already has) a company be impacted? How might these risks be sized, and what are the ripples that flow out from the specific forced labour order?
Clues to the answers to those questions can be found in the tools we’ve created, linked below. The framework for this analysis comes from a sequence of excellent discussions with some good friends, my own direct experience, and actual (public domain) references. Oh yes, and with a bit of AI assistance to put it all together.
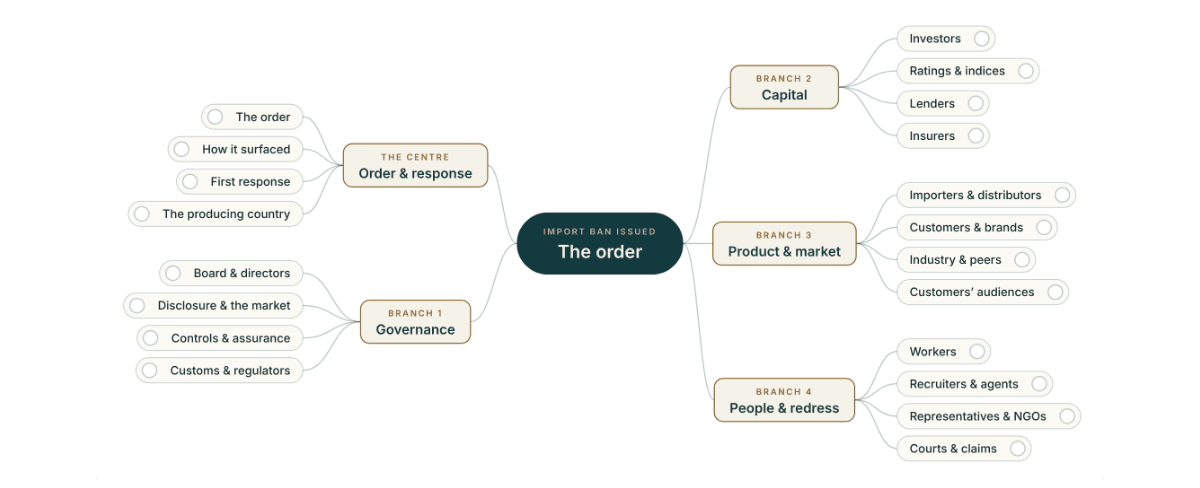
The key bit to understand is that a forced labour import ban rarely stays a customs matter. Take, for example, a US instance — perhaps attaching to product manufactured at your own operations. Under section 307 of the US Tariff Act, goods made wholly or in part with forced labour can be held at the border, and the order attaches to the product, not to the supplier’s compliance record at home. The impacts from the order ripple outward. Importers stop shipping, brand customers look for a second source, lenders and insurers ask what they are carrying, index providers review membership, auditors are asked what they missed, and workers’ claims can reach a court years after the goods were stopped.
Most companies have thought about one or two of these links. Very few have looked at all of them together, or at the order in which they arrive, or what they might all add up to.
We’ve built two tools to help explore the ripples from a potential forced labour order and to begin to size the potential costs. They draw on experience in how these cases unfold, but they describe no real company and are not built on any company’s figures.
Step 1, the ripple map, traces how a single order moves through 20 actors, from importers and customers to boards, lenders, regulators and workers, and lets you rate each one for your own business.
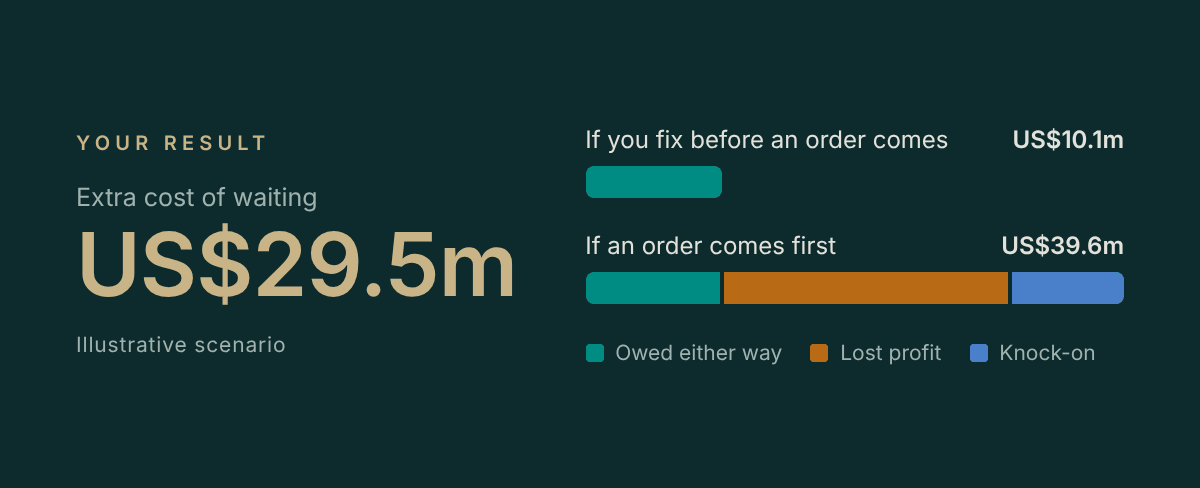
Step 2, the exposure calculator, puts numbers on it: what is owed to workers, how long release takes, the margin at risk, and what fixing the issues first (instead of waiting for enforcement action and fixing it after) would cost instead. In the illustrative scenario, being found first costs almost four times as much as fixing first.
Footnotes and explanations are included so you can see how each step or cost is derived.
Every input starts as an illustrative default for you to replace with your own. Both tools run entirely in your browser. Nothing you enter is sent to us or stored, and you can save your work and reopen it later. You can find both tools at illaesa.com/exposure-ripple-map.html and illaesa.com/exposure-calculator.html.
Obviously, these tools are for illustrative purposes and are not legal advice, and they will get better with use. If you try them and something is missing, or you see the cascade run differently in your sector, we would like to hear from you. Do ping us at hello@illaesa.com.